
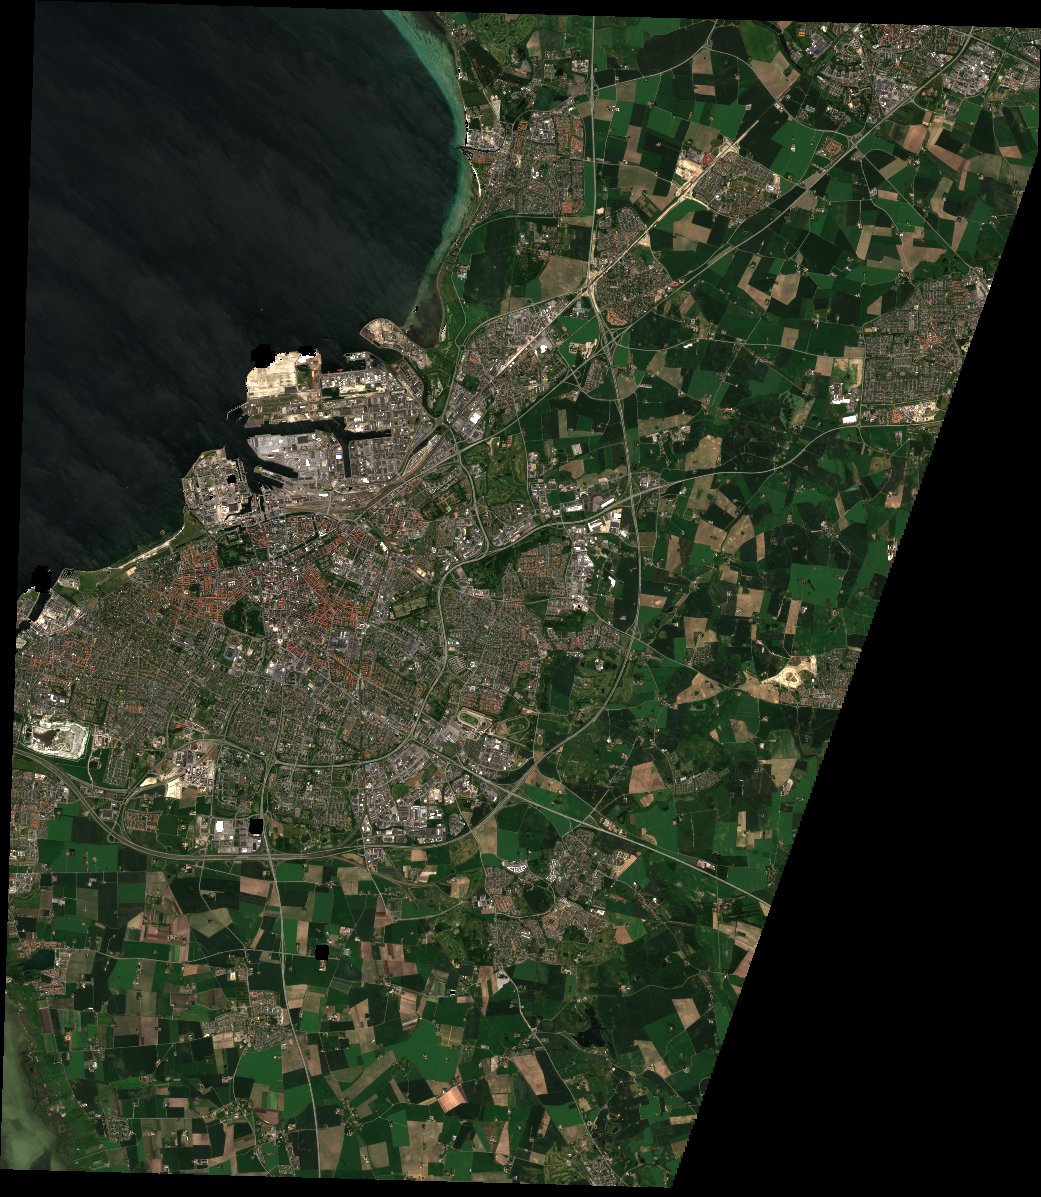
Compare models on one date
Pick a date, then for each map a model, its loss or training, its loss cell (U-Net models), its teacher weight (U-Net student only) and its inputs. Scroll or use + and − to zoom, drag to move: all maps follow. Hover to read the temperature at the same spot in every map.
Maps side by side
Go to
Zoom
×1.0
––
same scale on every map
UTM 33N · hover a map
Project team
This work is part of AI-driven Urban Heat and Health Analysis using Satellite Data for Climate-Resilient Planning, a project of Malmö University and Malmö stad.
Malmö University
Nosheen AbidPostdoctoral researcher, Sustainable Digitalisation Research CentreLeads the AI work: data integration and modelling
Raoof DoorshiLand surface temperature downscaling: models and maps
Helena BohmanDepartment of Urban StudiesGIS and spatial analysis
Elnaz SarkheyliDepartment of Urban StudiesUrban planning and nature-based solutions
Malmö stad
Marcus OhlströmCoordination across the city's departments
Karl McShaneDemographic analysis and data support